CloudStack 4.7 (which is due in the coming weeks) will introduce a new metrics view feature throughout the familiar CloudStack interface. We built this functionality to help system architects and admins comprehend resource utilisation and drill into the data to find performance hotspots. Whilst metrics have always been available via the CloudStack API a lot of information hasn’t been readily available in the GUI, and the idea was to make resource usage more easily accessible on the various CloudStack menus without having to click through multiple pages.
Use cases
- The metrics view allows easy resource usage monitoring from the GUI – especially when trying to narrow down high resource consumers among VM instances and disks, which in turn helps when making VM and storage migration decisions.
- The metrics view also assists in longer term capacity planning of the CloudStack infrastructure, giving a better overview of the resource usage in zones and clusters.
- In larger CloudStack estates the metrics view also gives a quick overview of the number of enabled / disabled zones, clusters and hosts.
Overview
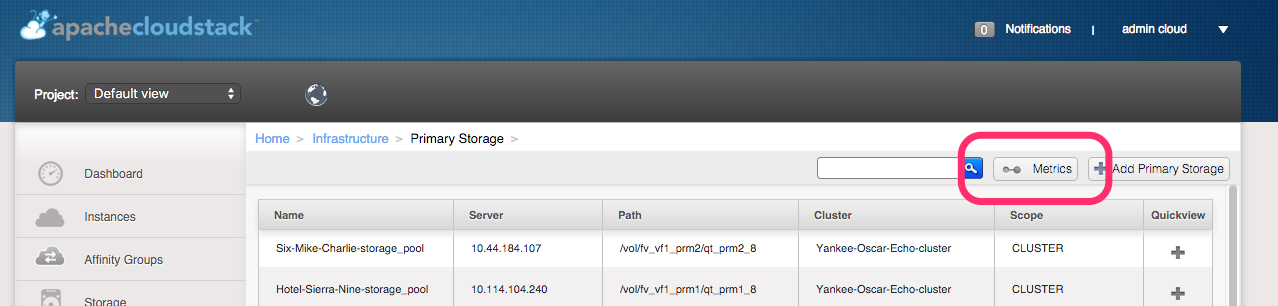
The metrics view is implemented on the Zone, Cluster, Hosts, Instances, Primary Storage and Storage pages and is accessed via the new metrics button on the menu bar.
On the metrics view pages there are a number of features to make the function usable:
- Similar to other CloudStack GUI pages all metrics pages have infinite scrolling – as you scroll down more data is loaded.
- All columns are sortable by clicking on the column heading.
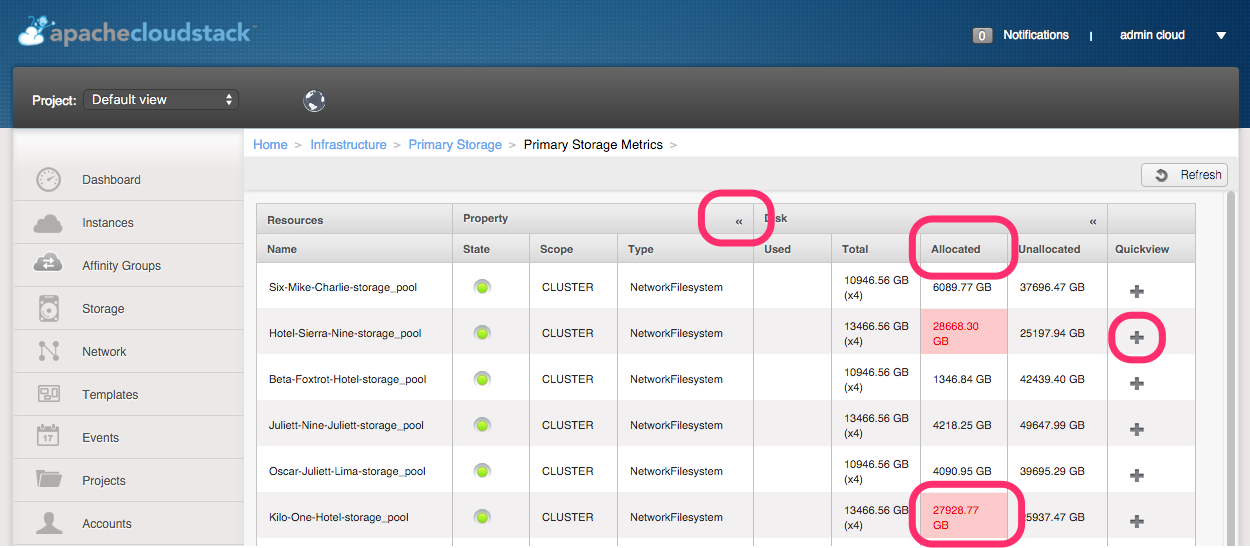
- Where CloudStack works with warning and disable limits in the global settings any value exceeding these limits will be flagged amber / red.
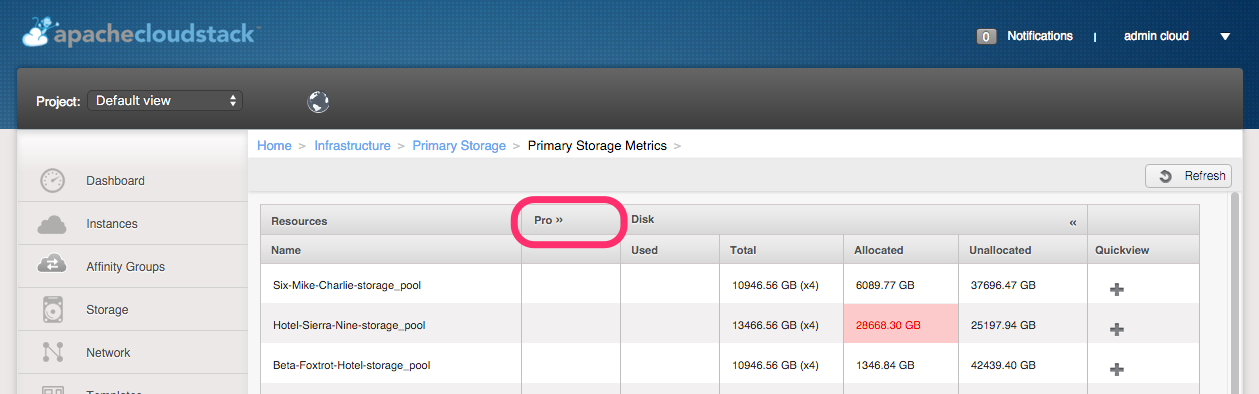
- Since the metrics view pages contain a lot of data each topic heading has a collapse button (<<) which collapses the topic column, thereby allowing more page space for the remaining columns. The collapsed column is expanded again by clicking the (>>) button next to the topic heading.
- All metrics view entries maintain the familiar Quickview button to access context specific functions.
- All metrics pages (apart from on the Primary storage pool page) operate in a hierarchy, making it easy to drill down through Zone > Cluster > Host > Instances > Volumes.
Collapsing the “Property” topic heading above allows for better view of the remaining columns:
Metrics view pages
Zone view
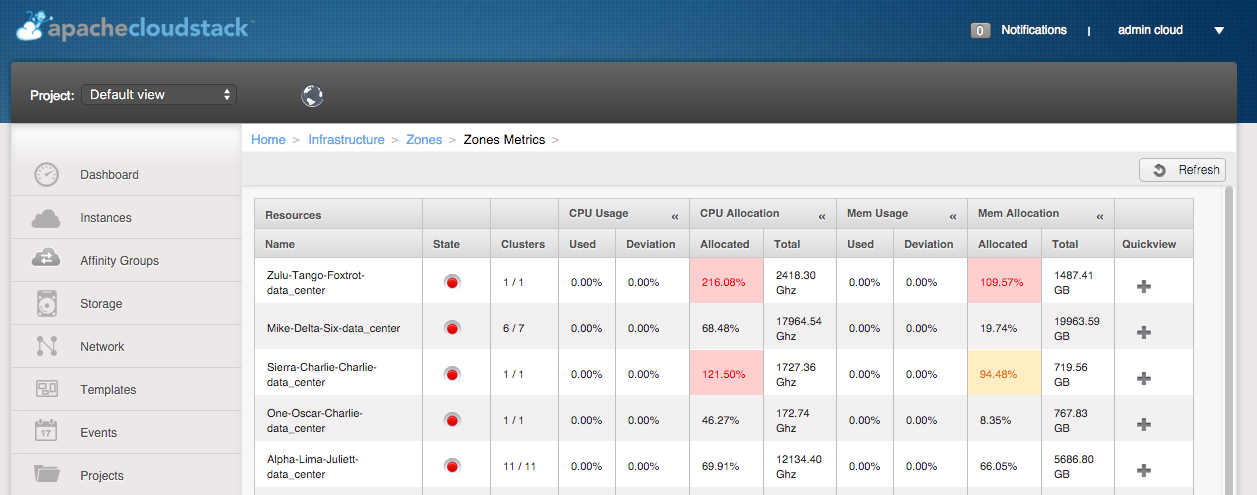
The Zone metrics view page gives an overview of resource usage in all zones in the CloudStack infrastructure. (Please note the screen shot above is using offline test data, hence does not represent a true view of resource usage and zone states). As described above this page will also flag any values which exceed the warning or disable threshold configured in global settings.
The Zone view page shows:
- Zone name: clicking on the zone name will navigate to the Clusters view for that specific zone.
- State: the enabled state of the zone.
- State: a count of (enabled clusters)/(total clusters) in the zone.
- CPU usage:
- Used: the average percentage of the CPU used metric for the clusters in the zone.
- Deviation: the max CPU usage deviation of any cluster compared to the average across all clusters.
- CPU allocation:
- Allocated: the average CPU allocation percentage across all clusters in the zone.
- Total: the total CPU allocation in GHz for the zone.
- Memory usage:
- Used: the average of the memory used metric per cluster in the zone.
- Deviation: the max memory usage deviation of any cluster compared to the average across all clusters.
- Memory allocation:
- Allocated: average of the memory allocated metric across all clusters.
- Total: the total memory allocation in GB across all clusters in the zone.
Cluster view
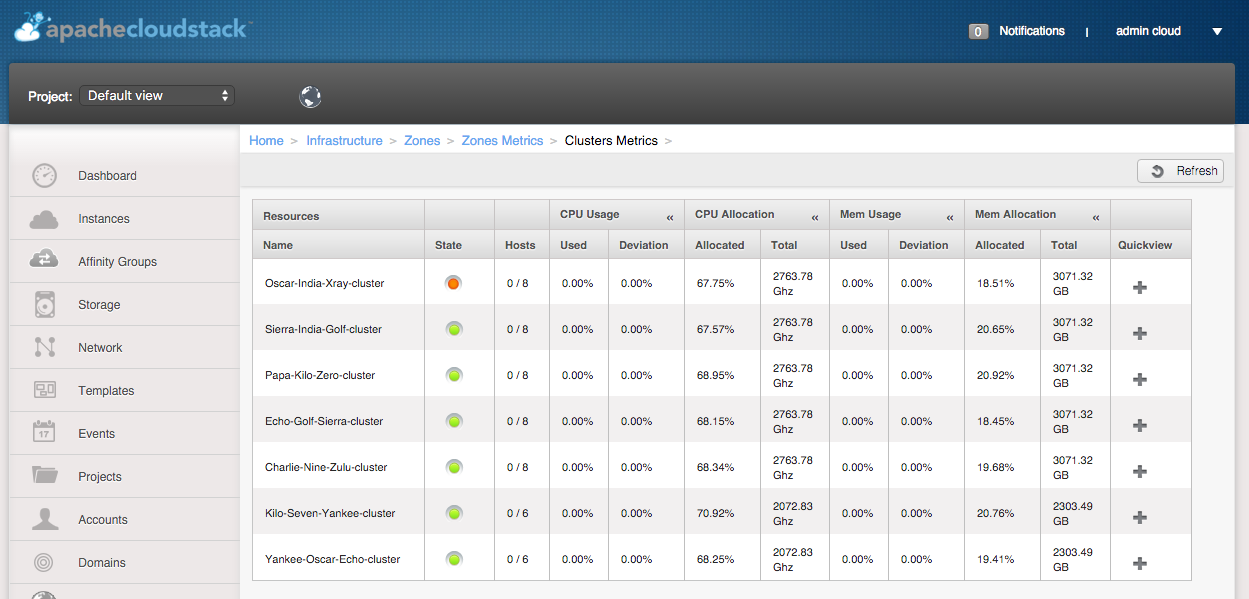
Clicking on any zone name in the zone metrics view will bring up the cluster metrics view. The same view can be found under the left hand Infrastructure menu > Clusters. This view provides similar statistics to the zone view – just in the context of each cluster and it’s hosts:
- Cluster name: clicking on the cluster name will navigate host metrics view for the cluster.
- State: the enabled state of the cluster.
- State: a count of (enabled hosts)/(total hosts) in the cluster.
- CPU usage:
- Used: the average percentage of the CPU used metric for the hosts in the zone.
- Deviation: the max CPU usage deviation of any host compared to the average across all hosts.
- CPU allocation:
- Allocated: the average CPU allocation percentage across all hosts in the cluster.
- Total: the total CPU allocation in GHz for the hosts in the cluster.
- Memory usage:
- Used: the average of the memory used metric per host in the zone.
- Deviation: the max memory usage deviation of any host compared to the average across all hosts in the cluster.
- Memory allocation:
- Allocated: average of the memory allocated metric across all hosts.
- Total: the total memory allocation in GB across all hosts in the zone.
Host view
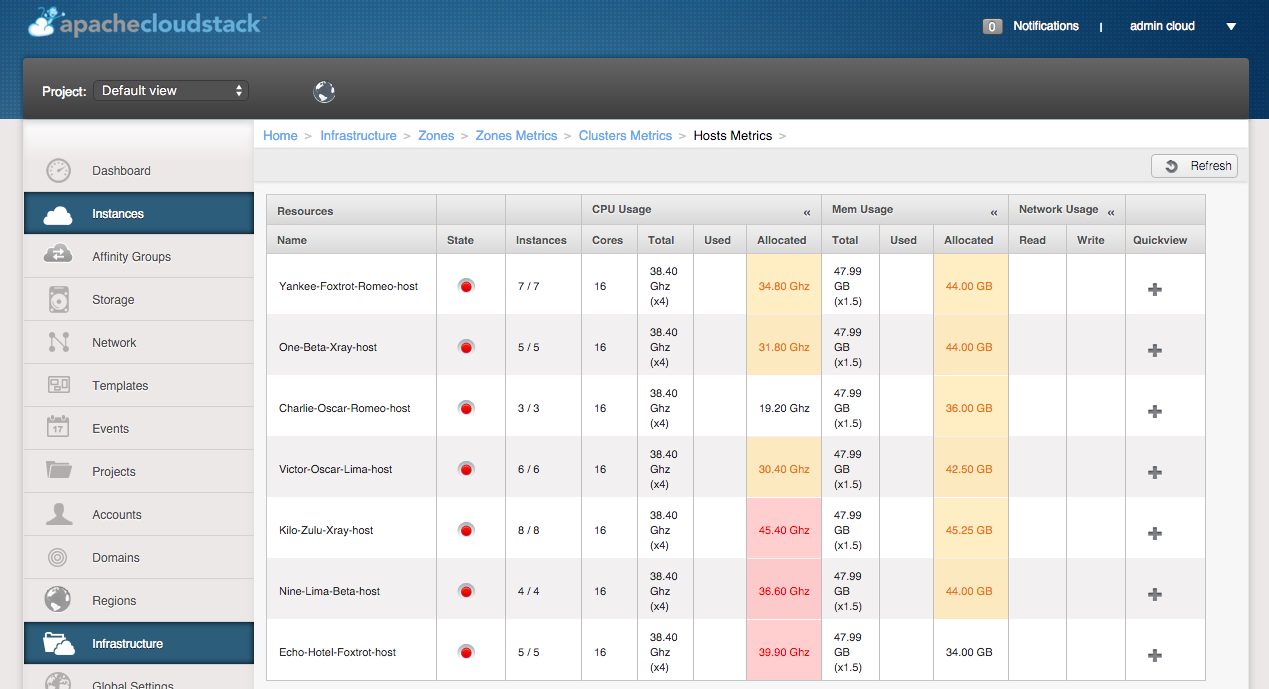
The host metrics view is accessed by drilling down from the clusters metrics view, alternatively from the left hand Infrastructure menu > Hosts > metrics button. (Again please note the screen shot above is using offline test data, hence does not represent a true view of resource usage and hosts states).
The host view presents:
- Host name: clicking on the host name will navigate to the VM instance metrics view for the host.
- State: the enabled state of the host.
- Instances: a count of (running VM instances)/(total VM instances) on the host.
- CPU usage:
- Cores: total number of CPU cores on the compute host.
- Total: total number of CPU resources (GHz) provided by the CPUs on the host. The figure in the bracket shows the CPU overprovisioning factor applied.
- Used: the total of CPU resources (GHz) currently used.
- Allocated: the total of CPU resources (GHz) allocated to the instances on the host.
- Memory usage:
- Total: the total memory for the host. The figure in brackets shows the memory overprovisioning factor.
- Used: the total amount of memory used by the VM instances running on the host.
- Allocated: the total memory allocated to all VM instances on the host.
- Network usage:
- Read: the cumulated network read bandwidth utilisation in GB.
- Write: the cumulated network write bandwidth utilisation in GB.
VM instance view
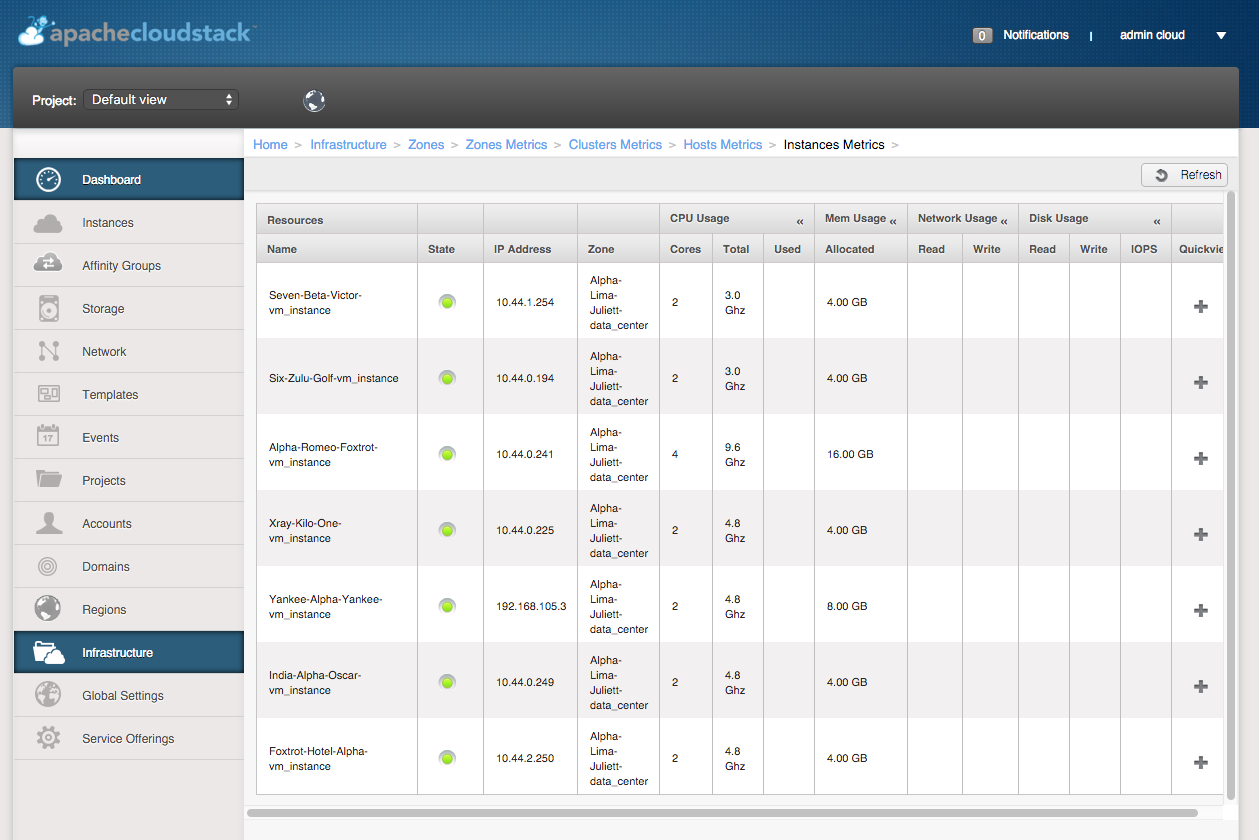
The VM instance view is accessed by drilling down from the hosts view, alternatively via the left hand Instances menu.
The view provides the following data:
- Name: the VM instance name. Clicking on the VM name will bring up the storage metrics view for the specific VM instance.
- State: shows the running state of the VM.
- IP address: the primary IP address for the VM instance.
- Zone: the name of the zone the VM is running in.
- CPU usage:
- Cores: number of CPU cores allocated to the VM.
- Total: total of CPU resources (GHz) allocated to the VM, i.e. (number of cores) x (CPU speed).
- Used: current CPU usage (GHz) of the VM.
- Memory usage:
- Allocated: the total amount of memory allocated to the VM instance.
- Network usage:
- Read: the cumulated network read bandwidth utilisation by the VM (GB).
- Write: the cumulated network write bandwidth utilisation by the VM (GB).
- Disk usage: this view will only show data when the underlying storage system provides statistics.
- Read: accumulated disk reads (MB) for the VM.
- Write: accumulated disk writes (MB) for the VM.
- IOPs: total number of IOPs (read + write) for the VM.
Volume usage view
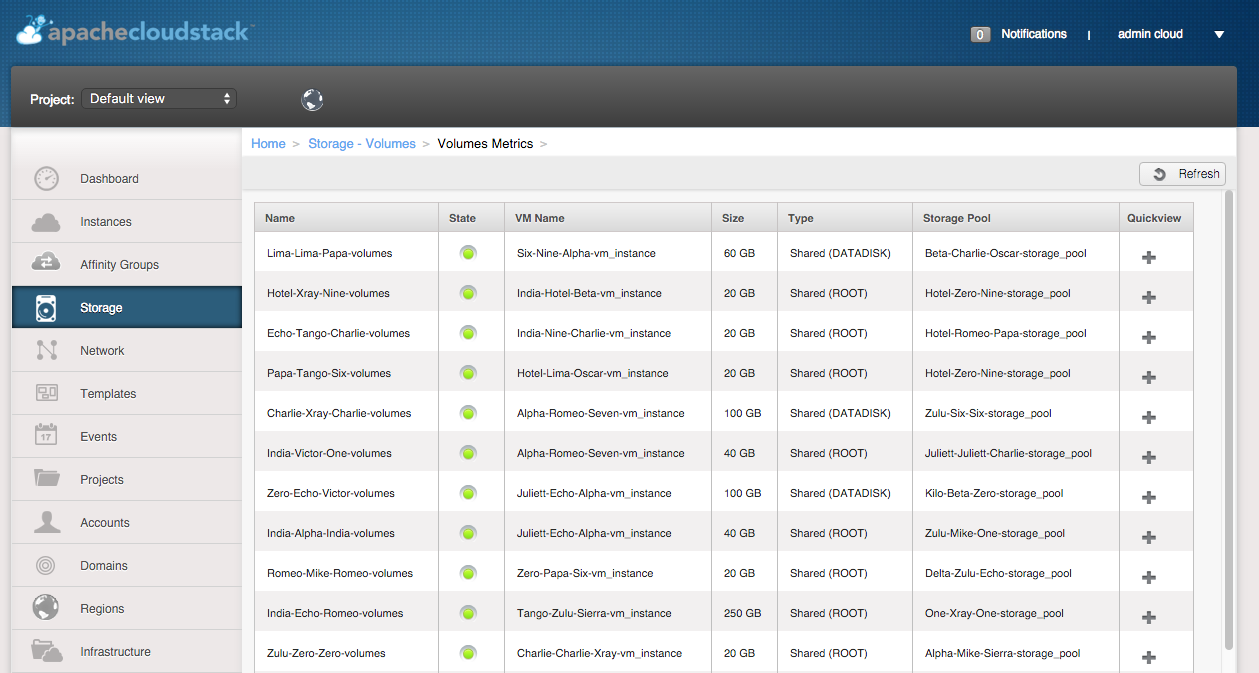
The storage volume metrics view can be accessed from the left hand Storage menu, which will show all storage volumes managed by CloudStack, or alternatively by drilling down from the VM instances metrics view, which will show only the volumes for the specific VM.
This view shows:
- Name: name of the storage volume (there is no further drill down from this page).
- State: shows the attached state of the volume.
- VM Name: the VM instance name the volume is attached to. This value is blank when the volume is detached.
- Size: volume size (GB).
- Type: VM root disk or a data disk.
- Storage pool: lists the storage pool where the disk is stored.
Primary storage view
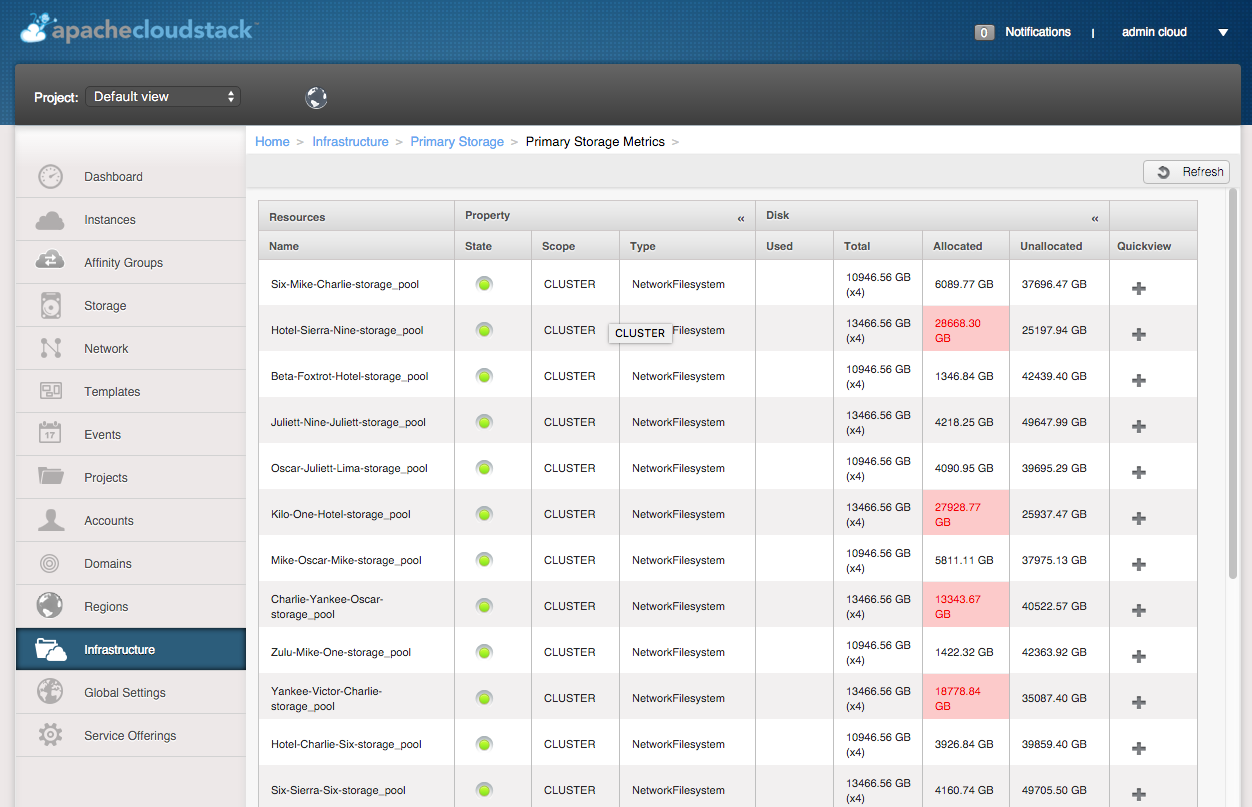
The Primary Storage metrics view can only be accessed from the left hand Infrastructure menu > Primary storage > metrics button.
The view lists:
- Name: primary storage pool name. Clicking the pool name will bring up the volume metrics view for all volumes stored on this primary storage pool.
- Property:
- State: up/down state of the primary storage pool.
- Scope: lists the scope of the pool, i.e. either “cluster” or “zone”.
- Type: storage type for the pool, e.g. NetworkFilesystem, VMFS, etc.
- Disk:
- Used: total GB used in the storage pool.
- Total: the total capacity of the pool. The figured in brackets lists the storage overprovisioning factor.
- Allocated: the current amount of allocated storage (GB) in the pool.
- Unallocated: the current amount of unallocated storage (GB) in the pool, taking overprovisioning into account.
Summary
All in all we hope the metrics view will be a really useful feature for anyone using CloudStack, especially those with larger CloudStack estates. As always we’re happy to receive feedback , so please get in touch with any comments, questions or suggestions.
About The Author
Dag Sonstebo is a Cloud Architect at ShapeBlue, The Cloud Specialists. Dag spends most of his time designing and implementing IaaS solutions based on on Apache CloudStack.
Giles is CEO and founder of ShapeBlue and is responsible for overall company strategy, strategic relationships, finance and sales.
He is also a committer and PMC member of the Apache CloudStack project, and Chairman of the European Cloudstack User Group, actively helping promote brand awareness of the technology.