Overview
In CloudStack 4.17 a brief overview of the status of various services can be retrieved. This includes information on the Management Server(s), the Database and the Usage server. This is a quick overview for operators. It does not replace a full-fletched monitoring system.
Use Case
It is now possible, within the Apache CloudStack, to know the status of its management infrastructure. The status should indicate which management servers are up, their memory, CPU use, internal telemetry such as workers in use, JVM memory use, the ‘health of MySQL host(s)’ etc. Of course, further enhancements and configurability is possible, but this is implemented as an MVP. It does not replace more elaborate features that require, for instance Prometheus or Grafana. For a description of how to extend it, see the details in ‘Future Extension’ section.
UI
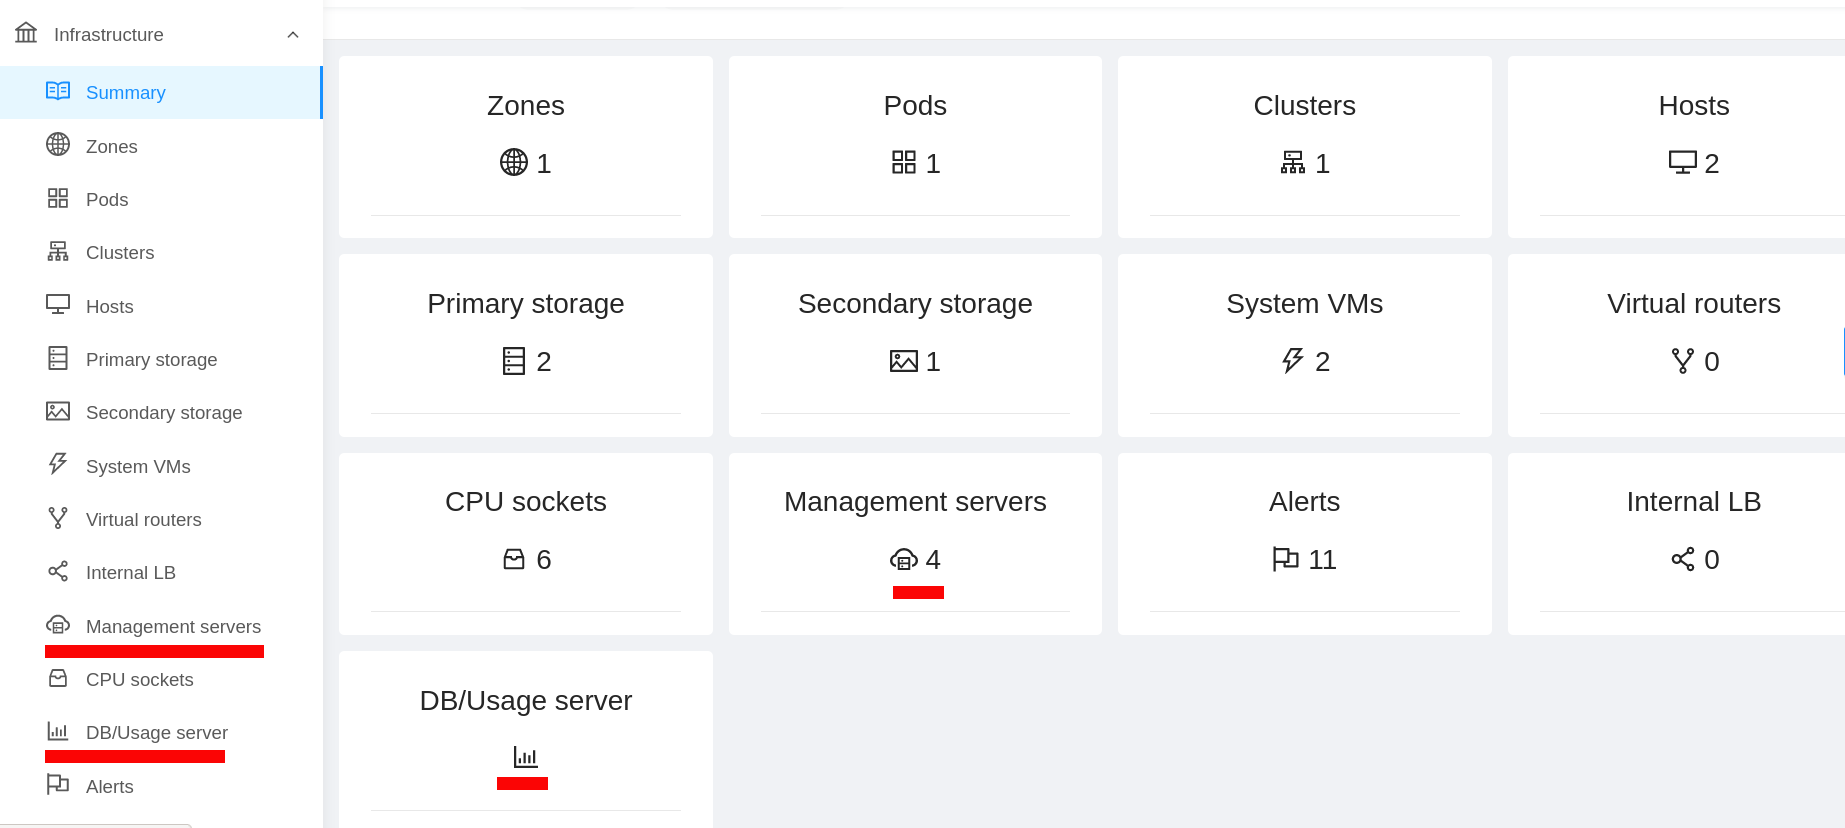
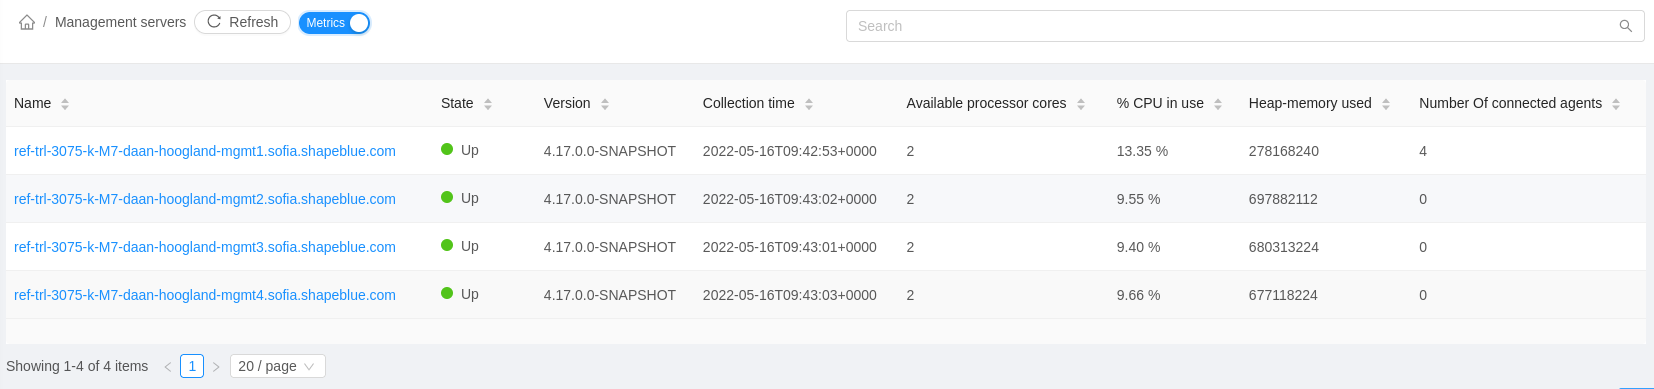
In the CloudStack console some items have changed. Such changes are marked with red in the picture below. The menu item for “Management Servers” has been extended to display the metrics. The item “DB/Usage Server” will lead to a new page that shows the database and usage statistics.
Management Server
The management server overview page has a button to toggle the metrics display.
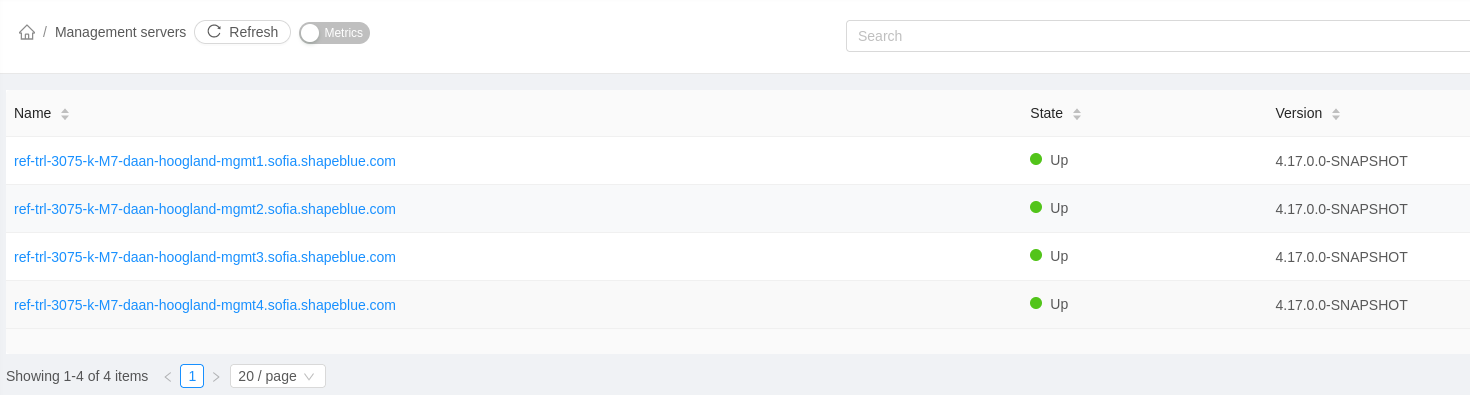
Now when toggling it a limited subset of the data shown on the details page will be shown on the overview page, as is done for most types of resources.
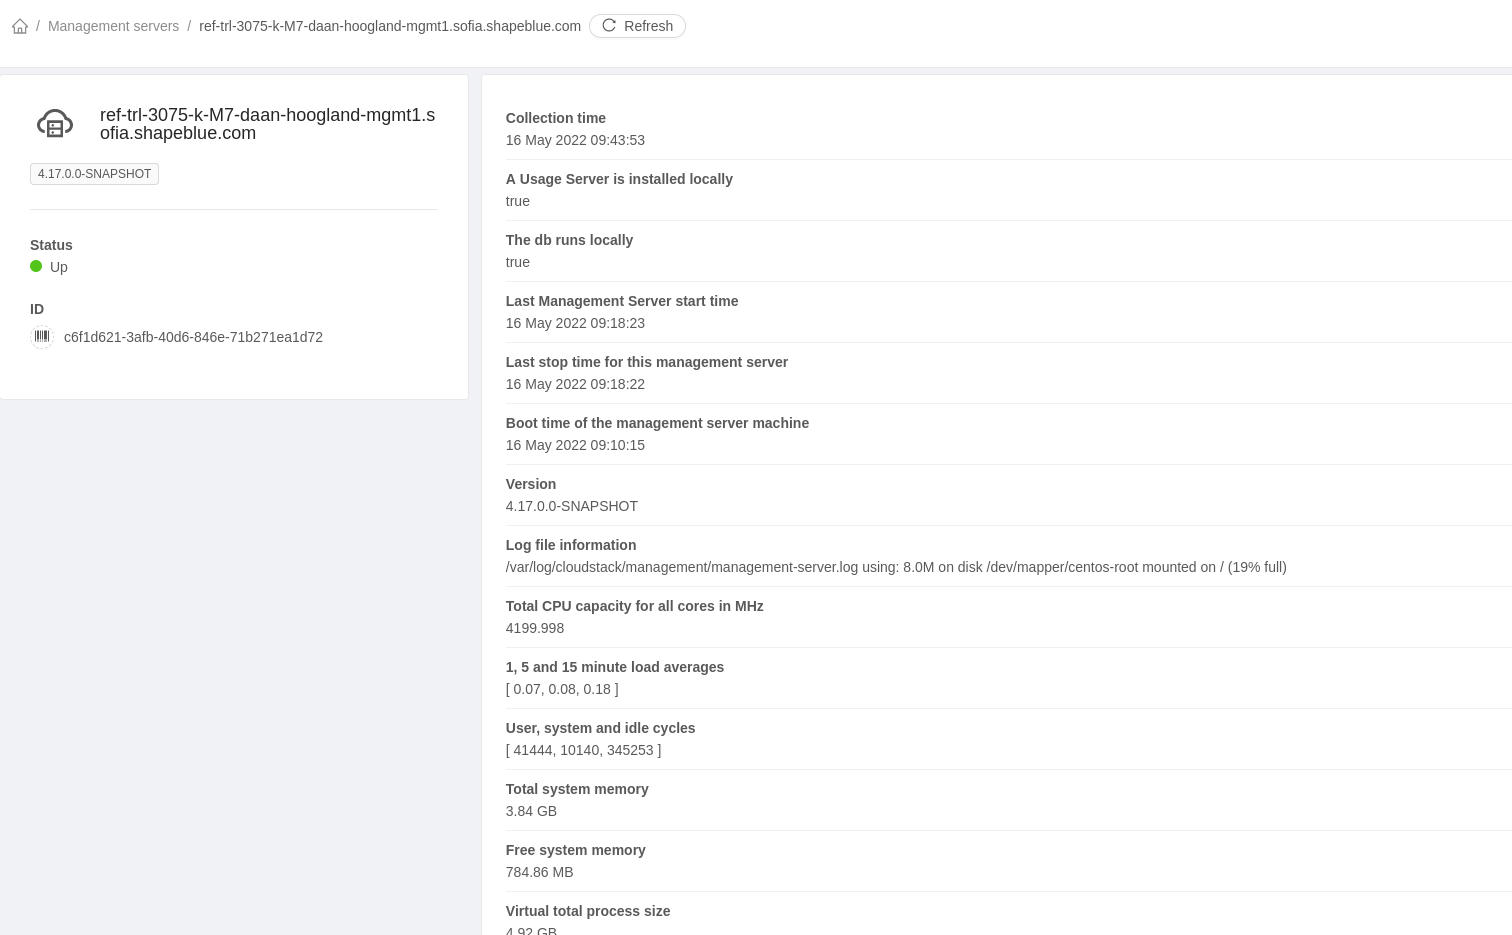
The details page for a management server might look like this; All the information is up to date as per the time-stamp in the field “Collection time”, at the top of the page. The information given will be described in the paragraph “Information” below.
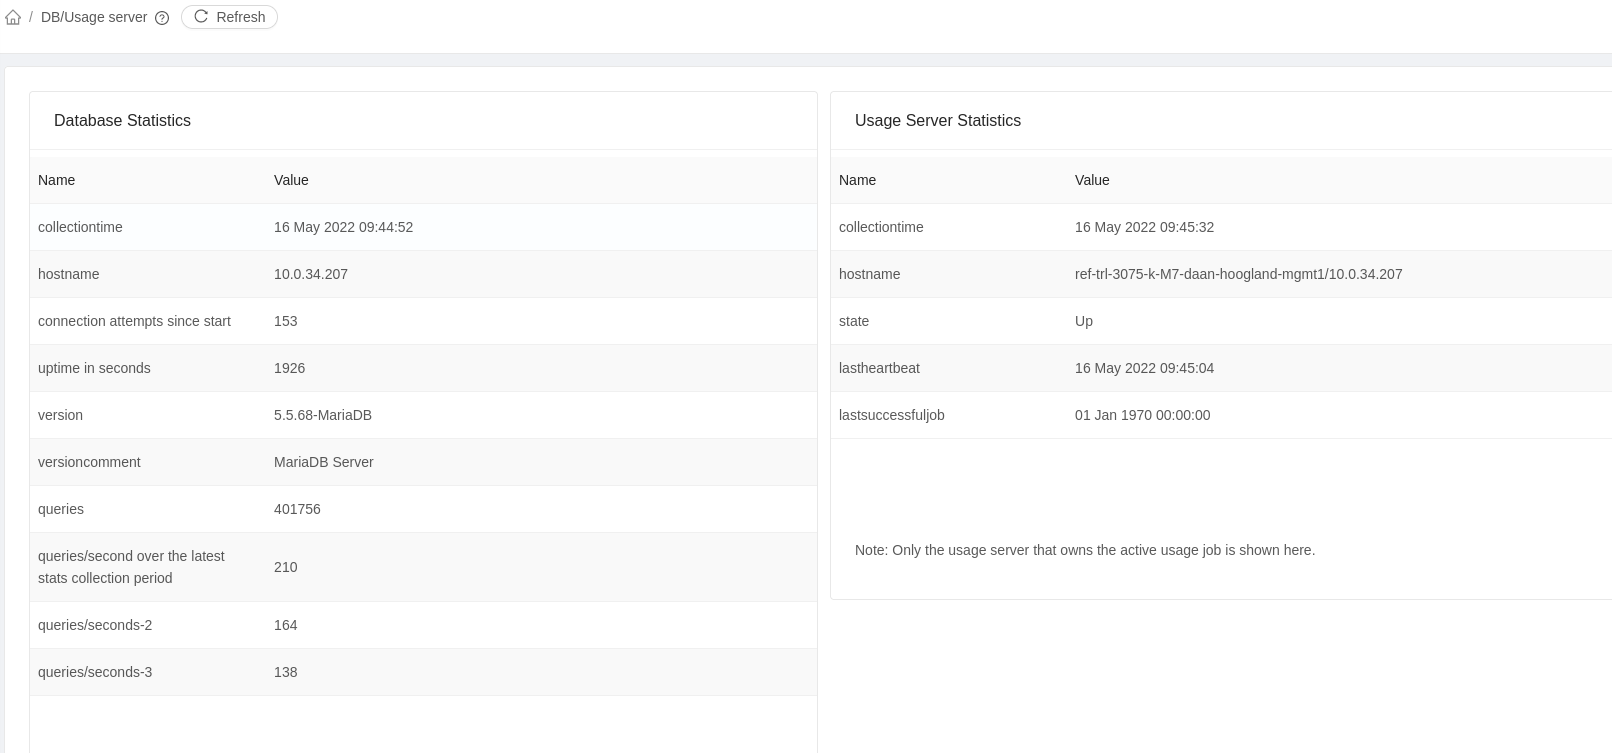
DB/Usage Server
An example of the “DB/Usage Server” section is shown below.
API
The API is extended with a set of new API calls and some global settings to control how the collection of data is done. The following are the new API endpoints implemented for this feature:
o ‘listManagementServersMetrics’,
o ‘listDbMetrics’
o ‘listUsageServerMetrics’ .
ListManagementServerMetrics
Parameters
“id”: The uuid of the management server.
“hostname”: the hostname of the management server.
Output
“agentcount”: the number of hosts that are controlled by this Management Server, this includes system Vm agents and host agents
“availableprocessors”: CPUs available to the MS process
“collectiontime”: timestamp for which the data returned was accurate
“cpuload”: percentage of CPU capacity used
“dbislocal”: is the DB running on the same machine as the MS
“heapmemorytotal”: the total amount of heap this server process has available
“heapmemoryused”: the amount of heap this server process uses at the time of recording
“javadistribution”: “Red Hat, Inc.”,
“javaversion”: “11.0.14.1+1-LTS”,
“kernelversion”: “3.10.0-957.12.2.el7.x86_64”,
“lastboottime”: The time the host on which this MS runs started.
“lastserverstart”: The time the server process started.
“lastserverstop”: The last time the server process for this host stopped.
“loginfo”: A description of the partition and the disk usage, i.e. “/var/log/cloudstack/management/management-server.log using: 48Mnon disk /dev/mapper/centos-root mounted on / (19% full)”,
“name”: (host)name of the management server
“osdistribution”: i.e. “CentOS Linux 7 (Core)”,
“sessions”: the number of active http sessions
“state”: “Up” or “Down”,
“systemcycleusage”: The system load for user, the system processes and the system idle cycles.
“systemloadaverages”: The load averages for 1, 5 and 15 minutes of the host
“systemmemoryfree”: “464.66 MB”,
“systemmemorytotal”: “3.84 GB”,
“systemmemoryvirtualsize”: “5.08 GB”,
“systemtotalcpucycles”: 4200,
“threadsblockedcount”: 0,
“threadsdaemoncount”: 13,
“threadsrunnablecount”: 10,
“threadsteminatedcount”: 0,
“threadstotalcount”: 397,
“threadswaitingcount”: 312,
“usageislocal”: ”true” if a Usage Server is running on the host of this Management Server. Note that this does not mean that it is the Usage Server that processes the usage records.
“version”: the CloudStack version running on this host, i.e. “4.17.0.0-SNAPSHOT”
listDbMetrics
Parameters
None
Output
“collectiontime”: The timestamp for which the data returned was accurate.
“connections”: the number of open DB connections
“dbloadaverages”: A list with the queries per second over the measured periods. The significance of these depends on the duration of the period setting ‘database.server.stats.interval’.
“hostname”: The host running the database server.
“queries”: the total number of queries that ran on the server since starting
“replicas”: A list of replicas for the DB if configured by the user.
“uptime”: The number of seconds since starting
“version”: i.e. “5.5.68-MariaDB”,
“versioncomment”: i.e. “MariaDB Server”
listUsageServerMetrics
Parameters
None
Output
“collectiontime”: The timestamp for which the data returned was accurate. For the Usage Server, this is usually the time of calling as none of the data needs collecting of pre-processing.
“hostname”: the name/ip of the host running the responsible usage server, note that this may be any of the management server hosts or a completely different host.
“lastheartbeat”: the last time the usage server checked for work ready to be done.
“lastsuccessfuljob”: the completion time of the last job
“state”: “Up” or “Down”.
Global Settings
The following are the new global settings introduced:
| Configuration | description | default |
| management.server.stats.interval | Time interval in seconds, for management servers’ stats collection. Set to <= 0 to disable management servers stats. | 60 |
| database.server.stats.interval | Time interval in seconds, for database servers’ stats collection. Set to <= 0 to disable database servers stats. | 60 |
| database.server.stats.retention | The number of queries/seconds values to retain in history. This will define for how many periods of ‘database.server.stats.interval’ seconds, the queries/seconds values will be kept in memory. | 3 |
Future Extension
For those that want to extend the feature, a small description of the implementation follows.
In a class named StatusCollector, the data is gathered and put into an object map with the id of the server as a key.
After collection, the data is send to any other MS that may be alive through the ClusterManager.
This is then also added to the above-mentioned object map.
On executing the APIs, the regular service data will be retrieved.
Following this, the metrics data will be retrieved. The responsibility for this will be delegated to the MetricService.
This service will in turn retrieve the appropriate record from the local StatusCollector.
Daan Hoogland has been a developer for 30 years. He joined the CloudStack community in 2012 and became a committer in 2013 and a PMC member later that year. After working on CloudStack during his time at Schuberg Philis and Leaseweb, Daan joined ShapeBlue in 2017 where he now builds and maintains CloudStack installations for several large customers and is part of the Software Engineering team. As a professional Daan subscribes to the idea that learning one language per year is a good objective. In. his free time, he enjoys cycling.