
Cloudstack’s multi-tenant virtualised networking model is one of its strongest features. Abstracting complex networking concepts and allowing simple UI/API configuration of networks is something loved by users of Cloudstack clouds. But, as an operator/administrator of a Cloudstack cloud you’ll almost certainly have had to troubleshoot network problems – and that means troubleshooting CloudStack’s Virtual Routers (VRs) .
As Roy says in the picture , turning it off and on again can often resolve issues with a VR (or restarting a VR in Cloudstack language). But if that doesn’t work, administrators need to troubleshoot the VR. In this article, I will discuss some of the common approaches to such troubleshooting and look at some new CloudStack features that have been added to make this process much easier for administrators.
The problem
Now let’s try to imagine what could be wrong with our VR? The first and most obvious things are mistakes when defining IP range, netmask and gateway for our networks, or general human errors when building out infrastructure elements. CloudStack does provide some validation of the input you give, but it’s not guaranteed to pick up every mistake.
Then, most commonly we could have connectivity issues. The list is endless here, from inside the router itself to the Internet, other VPC/networks, Private Gateways and so on. To resolve such issues, we’ll need some serious networking skills and time to investigate, and most of the time it happens to be one tiny bit of configuration that we’ve missed or misconfigured.
Solution
To get to the bottom of these issues, it is often required to dig through all configurations, run connectivity troubleshooting in and out of a machine and so on, which can be painful and time consuming. CloudStack now offers two new features which will make our life easier and troubleshooting of the VR far more painless to the root admin. Let me introduce you to the “Run Diagnostics” and “Get Diagnostics” features from the VR. Using these two features an administrator will be able to get valuable information from the virtual router without even logging in to it. Furthermore, he’ll be able to operate from the inside of the router and execute scripts, commands etc. to determine what’s wrong or even fix it.
Let’s dive into details of these features.
Run diagnostics
The new “Run diagnostics” feature allows root administrators to execute connectivity diagnostics commands from the VR to a given target, which could be a host on the internet or some other internal element from our infrastructure that we need to make sure is reachable. This enables us to trace how the traffic goes in and out from the VR. The available commands are ping, arping and traceroute. Admins can execute those with any standard option and argument that they support under the VR operating system (Debian). CloudStack effectively logs in to the VR and executes the exact command with the given options and parameters, then it will display back the response within the management console UI.
Here’s a simple example of ping command being sent to google.com:
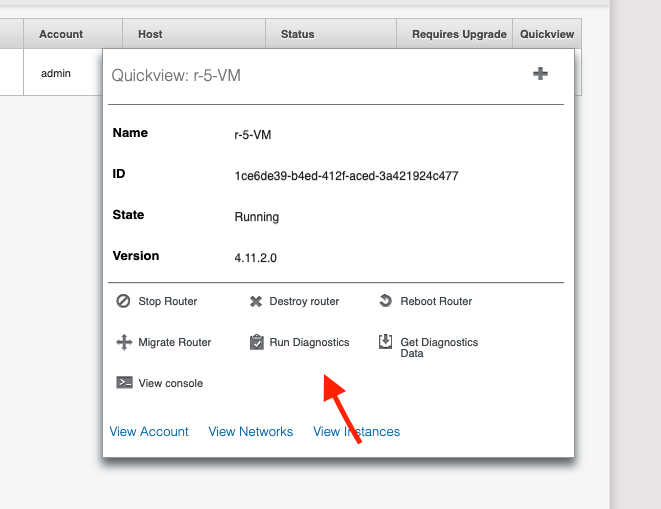
From Infrastructure section in the GUI, we select the VR and click on Run Diagnostics:
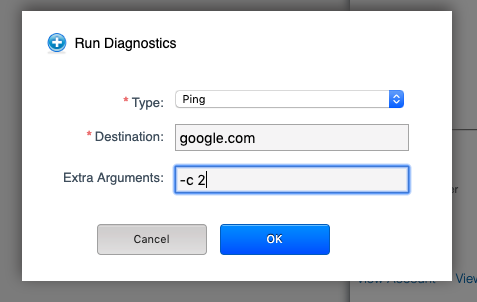
Then select the command you want to execute, add destination and any extra arguments and click OK.
This comes the back with the VR response:
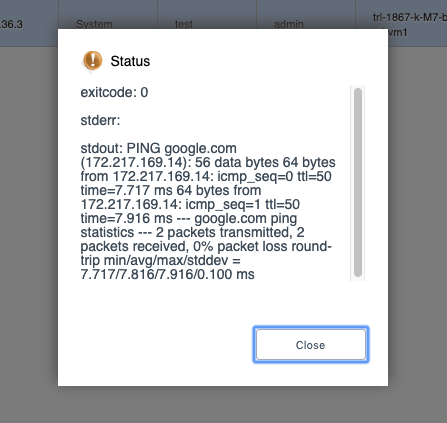
Likewise, admins can do traceroute and arping.
Obviously, there’s a new API created for this which can be used with cloudmonkey. Here’s an example how to do that:
(localcloud) SBCM5> > run diagnostics targetid=f08d92b6-4839-4ca5-8924-bb2c59ce14c2 ipaddress=google.com type=ping params='-c 2'
{
"diagnostics": {
"exitcode": "0",
"stderr": "",
"stdout": "PING google.com (216.58.198.174): 56 data bytes\n64 bytes from 216.58.198.174: icmp_seq=0 ttl=50 time=7.664 ms\n64 bytes from 216.58.198.174: icmp_seq=1 ttl=50 time=7.645 ms\n--- google.com ping statistics ---\n2 packets transmitted, 2 packets received, 0% packet loss\nround-trip min/avg/max/stddev = 7.645/7.654/7.664/0.000 ms"
}
}
…where the targetId is the given ID of the VR in the test.
Run diagnostics is available as of 4.12 release and it is hypervisor agnostic.
Get Diagnostics Data
This feature, intended to be used by root administrators provides a way to retrieve any file from system VMs if the file path is known and specified as input. By default, the API gathers logs and configuration/property files and sends them as compressed tarball to a secondary storage pool within the same zone as the target system VM. A download URL is returned to the operator on successful file retrieval to allow him to download it to their local machines.
The API can be executed against all three types of system VMs, each of them having a separate default list of files and configurations it’ll gather. Here’s a list of the defaults for each system VM type:
• VR – ‘diagnostics.data.vr.defaults’ global setting:
“IPTABLES], [IFCONFIG], [ROUTE], /etc/dnsmasq.conf, /etc/resolv.conf, /etc/haproxy.conf, /etc/hosts.conf, /etc/dnsmaq-resolv.conf, /var/log/cloud.log, /var/log/routerServiceMonitor.log, /var/log/dnsmasq.log”
• CPVM – ‘diagnostics.data.cpvm.defaults’ global setting
“[IPTABLES], [IFCONFIG], [ROUTE], /usr/local/cloud/systemvm/conf/agent.properties, /usr/local/cloud/systemvm/conf/consoleproxy.properties, /var/log/cloud.log”
• SSVM – ‘diagnostics.data.ssvm.defaults’ global setting
“[IPTABLES], [IFCONFIG], [ROUTE], /usr/local/cloud/systemvm/conf/agent.properties, /usr/local/cloud/systemvm/conf/consoleproxy.properties, /var/log/cloud.log”
Please note that one could change the default to include custom files/scripts. To get the defaults from a System VM the admin simply calls the API just giving a target. To call a custom script the root administrator will also have to make sure the script is present at the “/usr/bin” directory on the system VM and can be executed. Once there, it’s name needs to be passed in square brackets, like this: [script]. It also accepts list of values separated by comma.
Here’s where to find it in the CloudStack Console:
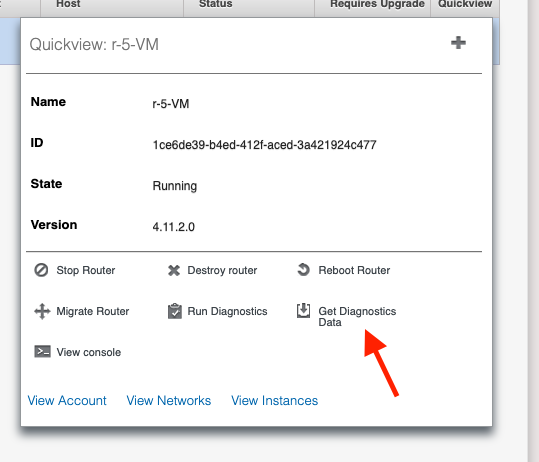
Pick a VR and expand the quick view options, then you’ll be able to see ‘Get Diagnostics Data’ button and click on it:
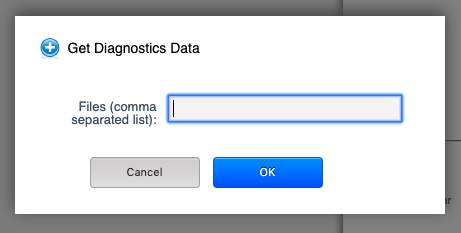
After that, a pop-up would appear, taking one argument ‘Files’. Leave blank to get the defaults or fill in absolute paths to files or commands in [brackets] as custom values
Defaults:
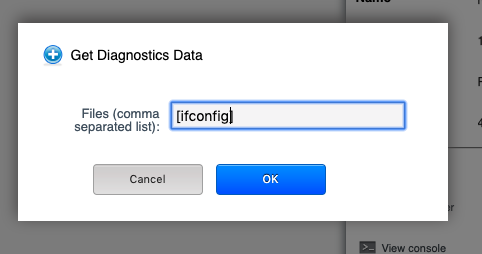
or a command:
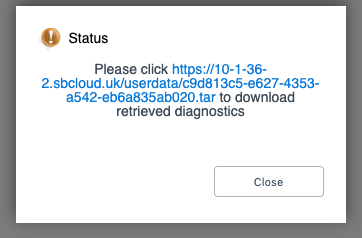
Once executed, SSVM will gather all the content in an archive and you’ll be given an URL to download it from:
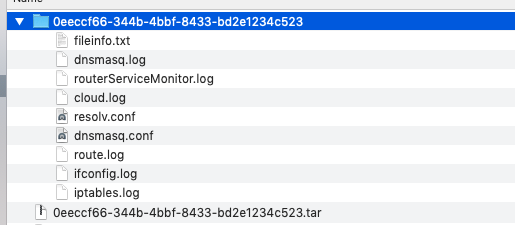
And here’s the containing of the tar archive defaults for Virtual router:
Here’s an example how to use it directly calling the API from cloudmonkey:
(localcloud) SBCM5> > get diagnosticsdata targetid=1ce6de39-b4ed-412f-aced-3a421924c477 files=[ifconfig]
{
"diagnostics": {
"url": "https://10-1-36-2.sbcloud.uk/userdata/0ff2e4ae-8b55-49a0-815e-22185e45a7d1.tar"
}
}
The following global settings were introduced with Get Diagnostics FR, which let you control and configure the feature and most specifically how it uses the secondary storage of your datacenter. It’s a good practice to keep the garbage collection enabled and running so you don’t end-up with secondary storage occupied with diagnostics logs. Following is list of configurations that the admin can use.
| Setting | Description | Default Value |
|---|---|---|
| diagnostics.data.gc.enable | Enable the garbage collector background task to delete old files from secondary storage. Requires management server restart | True |
| diagnostics.data.gc.interval | The interval at which the garbage collector background tasks in seconds. Requires management server restart | 86400 (Once a day) |
| diagnostics.data.retrieval.timeout | Overall system VM script execution time out in seconds. Does not require management server restart. | 3600 |
| diagnostics.data.max.file.age | Sets the maximum time in seconds a file can stay in secondary storage before it is deleted. | 86400 (1 day) |
| diagnostics.data.disable.threshold | Sets the secondary storage disk utilisation percentage for file retrieval. Used to look for suitable secondary storage with enough space, otherwise an exception is thrown when no secondary store is found. | 0.95 (95 %) |
Conclusion
Get Diagnostics (cloudstack-#3350) has been submitted against master and against the 4.13 milestone, so hopefully it’ll make it in the next LTS release. Run Diagnostics (cloudstack-#2833) has been merged as of 4.12 release. Both are available from the UI and API, independent of the hypervisor used in CloudStack, they are handy, neat and can save tons of time accessing the VRs and finding what you need from them. Furthermore, they could be used to monitor and automate some of the processes on the VR if required.
About the author
Boris Stoyanov is Software Engineer in testing at ShapeBlue, the Cloud Specialists. Bobby spends his time testing features for the Apache CloudStack Community and for ShapeBlue clients.
Boris is a QA Engineer who found his ikigai in Apache CloudStack. Since 2016, he has been involved in testing CloudStack working for ShapeBlue. Boris is also usually driving forward a lot of community initiatives like the GSoC. In his free time, he enjoys hiking, boxing and other sports. Boris is a father of two young girls and spends most of his time on family activities.